Retail Analytics Platform
Executive Summary
End-to-end analytics pipeline extracting actionable customer and revenue insights from transactional data using Python, PostgreSQL, and Power BI. Delivered a 360-degree view of customer behaviour and revenue drivers for strategic decision-making.
Technical Implementation
Data Pipeline & Infrastructure
- Python (Pandas): Data cleaning, transformation, and preprocessing of raw transactional datasets
- PostgreSQL: Relational schema design with enforced referential integrity and primary/foreign keys
- Advanced SQL: CTEs, window functions (LAG), and complex aggregations for temporal analysis
- Power BI: Interactive dashboards with dual views—Executive Overview and Customer Analytics
Analytics Developed
- Month-over-Month Growth Analysis: LAG() window function to track revenue trends and growth velocity
- Cohort Retention Analysis: Customer segmentation by acquisition period to measure repeat behaviour
- Customer Lifetime Value (CLV): Model quantifying total profit from each customer relationship
- Repeat Purchase Rate: 3% repeat purchase rate identified as key retention opportunity
- Revenue Concentration: Top 20 customers contributing 81% of total revenue—high-value retention target
Database Design
Normalized relational schema with enforced referential integrity across customer, order, product, and transaction tables. Designed for data consistency and efficient analytical queries.
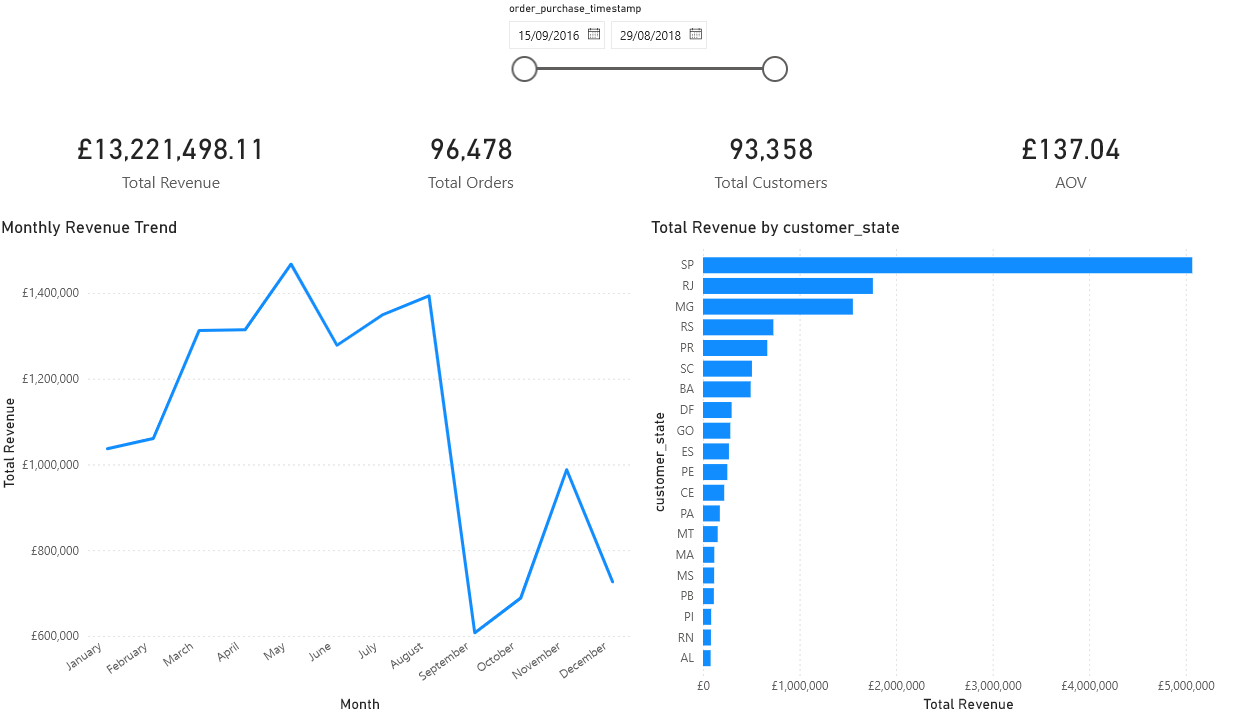
Executive Overview Dashboard — Key metrics, revenue trends, and business KPIs at a glance

Customer Analytics Dashboard — Cohort performance, repeat purchase patterns, and CLV segmentation
Business Insights Uncovered
Revenue Concentration Risk
81% of revenue generated by top 20 customers. This concentration identifies critical retention targets and exposes business vulnerability to customer churn among high-value segments.
Purchase Behaviour Pattern
3% repeat purchase rate indicates significant opportunity for loyalty intervention. Low repeat rate suggests friction in post-purchase experience or customer engagement strategy.
Cohort Performance Tracking
Retention trends segmented by acquisition period reveal cohort quality variation, enabling data-driven decisions on marketing spend allocation and campaign timing.
Strategic Implications
- Prioritise VIP customer retention programmes to protect revenue base
- Investigate barriers to repeat purchase through post-transaction analytics
- Allocate marketing budget toward cohorts showing strongest retention curves
- Implement tiered pricing or loyalty mechanics to improve CLV across lower-value segments
Impact & Outcome
Transformed raw transaction data into a decision-support system that quantifies customer value, prioritises retention efforts, and highlights revenue concentration risk. The platform enables data-driven customer strategy by:
- Replacing ad-hoc reporting with automated, repeatable analytics
- Providing executive visibility into key drivers of profitability
- Identifying actionable segmentation for targeted interventions
- Establishing baseline metrics for measuring intervention success
Key Takeaway: Shifted decision-making from intuition to evidence by embedding advanced SQL analytics, cohort analysis, and CLV modelling into the organisation's standard reporting infrastructure.
Technical Skills Demonstrated
Data Engineering
- ETL pipeline design and data quality assurance
- Relational database schema design with ACID compliance
- Referential integrity enforcement and constraint management
SQL & Analytics
- Window functions (LAG, ROW_NUMBER, RANK) for time-series analysis
- Common Table Expressions (CTEs) for modular query design
- Aggregation and grouping for multi-dimensional analysis
- Complex joins and subqueries for consolidating data views
Business Analytics
- Cohort analysis methodology
- Customer lifetime value modelling
- Revenue concentration and Pareto analysis
- Trend analysis and growth measurement
Visualisation & Communication
- Interactive Power BI dashboard design
- Executive-level reporting and insight translation
- Stakeholder-friendly KPI presentation
Tech Stack
Python (Pandas) • PostgreSQL • SQL (CTEs, Window Functions) • Power BI • Data Modelling
Interactive Power BI Dashboards

Executive Overview Dashboard - High-level KPIs and revenue trends
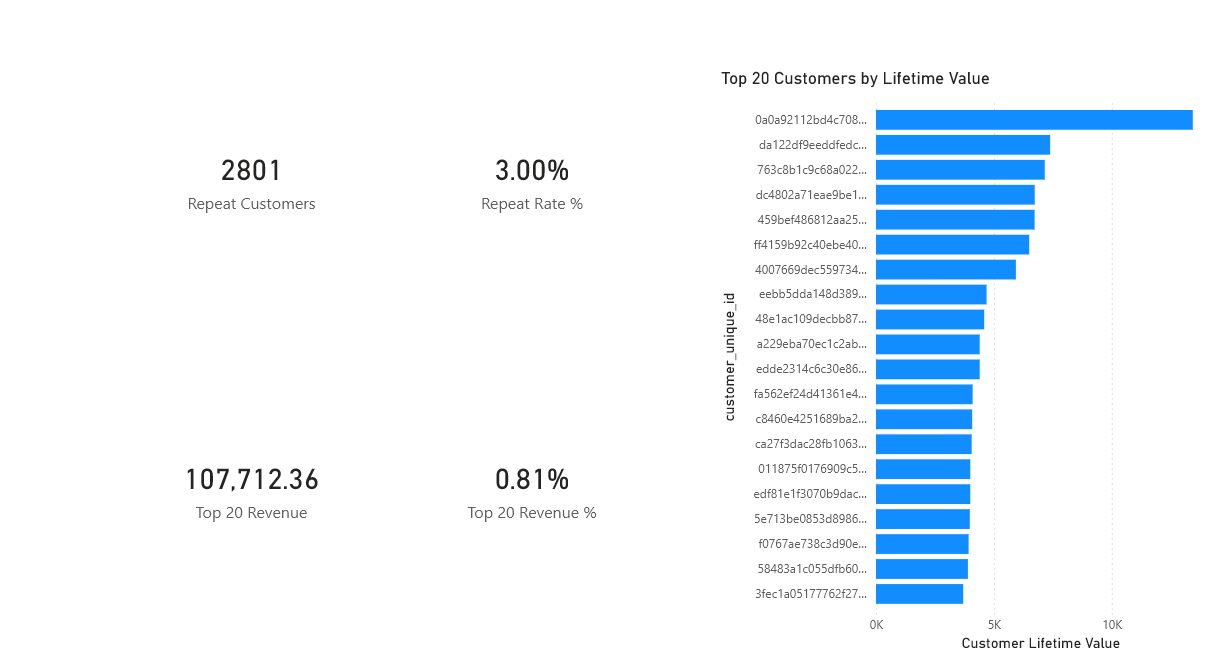
Customer Analytics Dashboard - CLV, retention, and segmentation views
Why This Project Matters
This project demonstrates capability across the entire analytics workflow: structured data design, sophisticated SQL analysis, statistical thinking, and executive communication. It emphasises problem-solving and business impact over tool proficiency.
Ideal for Data Analyst, Junior Data Scientist, or BI Developer roles requiring SQL fluency, business acumen, and analytics methodology.
Back to Projects