Heart Disease Prediction AI Model

About the Project
A production-grade ML pipeline for cardiovascular disease risk prediction using ~309,000 patient samples. Focuses on engineering discipline: preventing data leakage, proper class imbalance handling, metric literacy, explainability via SHAP, and reproducibility—reflecting real-world ML concerns where accuracy alone can mislead.
Highlights
- Logistic Regression achieves 0.836 ROC-AUC with 79.3% recall (identifies high-risk cases)
- Data leakage prevention: train/validation/test split before preprocessing, SMOTE on training only
- Class imbalance handling: proper metrics (ROC/PR-AUC) instead of accuracy; cost-based threshold optimization
- SHAP explainability for global and local interpretability in high-stakes decisions
- Reproducible engineering: fixed seeds, pinned dependencies, persisted artifacts, JSON metadata
- Honest assessment: acknowledges dataset limitations and absence of fairness analysis
The Problem Solved
Most ML projects introduce subtle critical errors: data leakage, improper class imbalance handling (~92% dummy baseline), misleading metrics, and unstable explanations. This project engineers around these pitfalls to create a trustworthy system for regulated healthcare contexts.
Key Results
Best Model (Logistic Regression): ROC-AUC 0.836, Recall 79.3%, Precision 20.7% (reflects 8-9% positive class prevalence). Demonstrates proper metric selection—accuracy (~92% baseline) would be deceptive; ROC/PR-AUC and threshold tuning reveal true utility.
What I learned
- Data leakage prevention: split before preprocessing is non-negotiable; SMOTE on training only
- Class imbalance in medical contexts requires careful metric selection and cost-based threshold optimization
- Explainability in regulated domains: SHAP analysis is central to design, not an afterthought
- Reproducibility and auditability are core requirements in regulated ML systems
- Feature importance requires cross-fold stability checks to distinguish signal from noise
Next steps
- Fairness analysis: detect and mitigate bias across demographic groups
- Feature engineering: incorporate time-series elements (blood pressure trends)
- Model deployment: create inference API with confidence intervals
Tech
Python • Scikit-Learn • SMOTE • SHAP • XGBoost • Pandas • Matplotlib
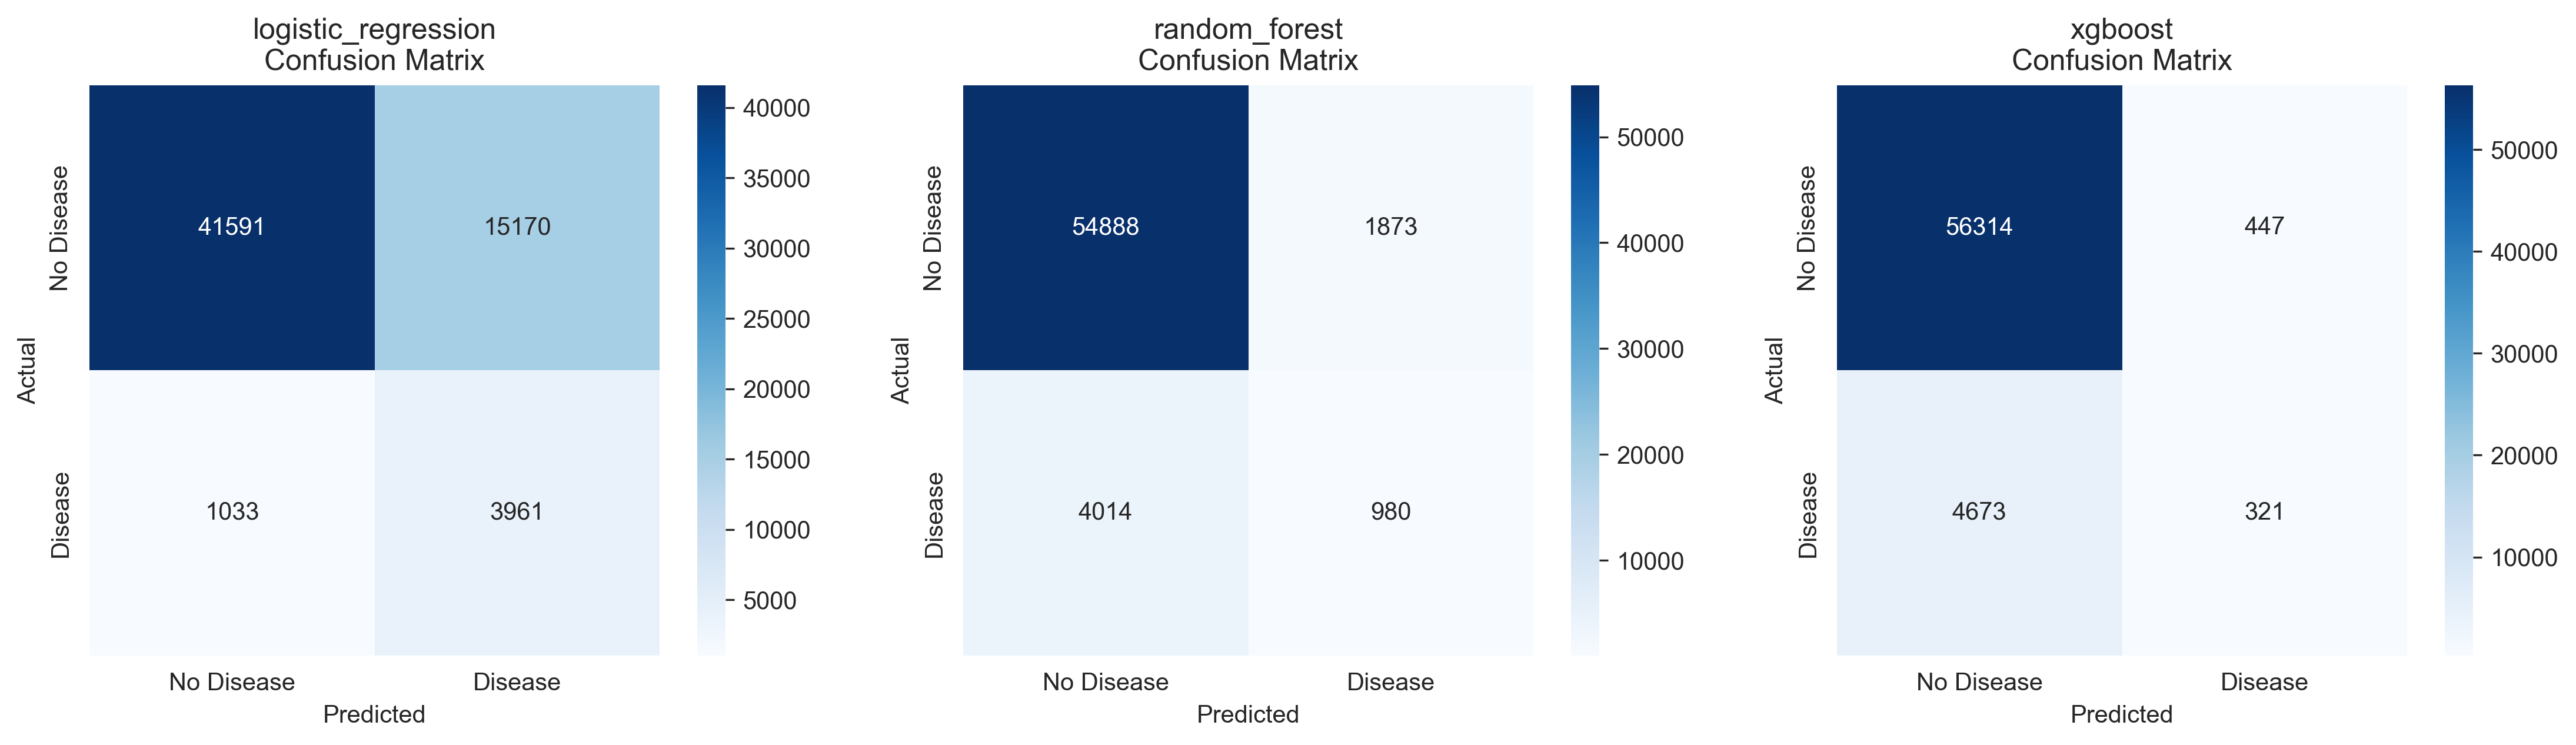
Confusion Matrices - Detailed breakdown of true positives, false positives, true negatives, and false negatives for each model, showing prediction accuracy across all classes
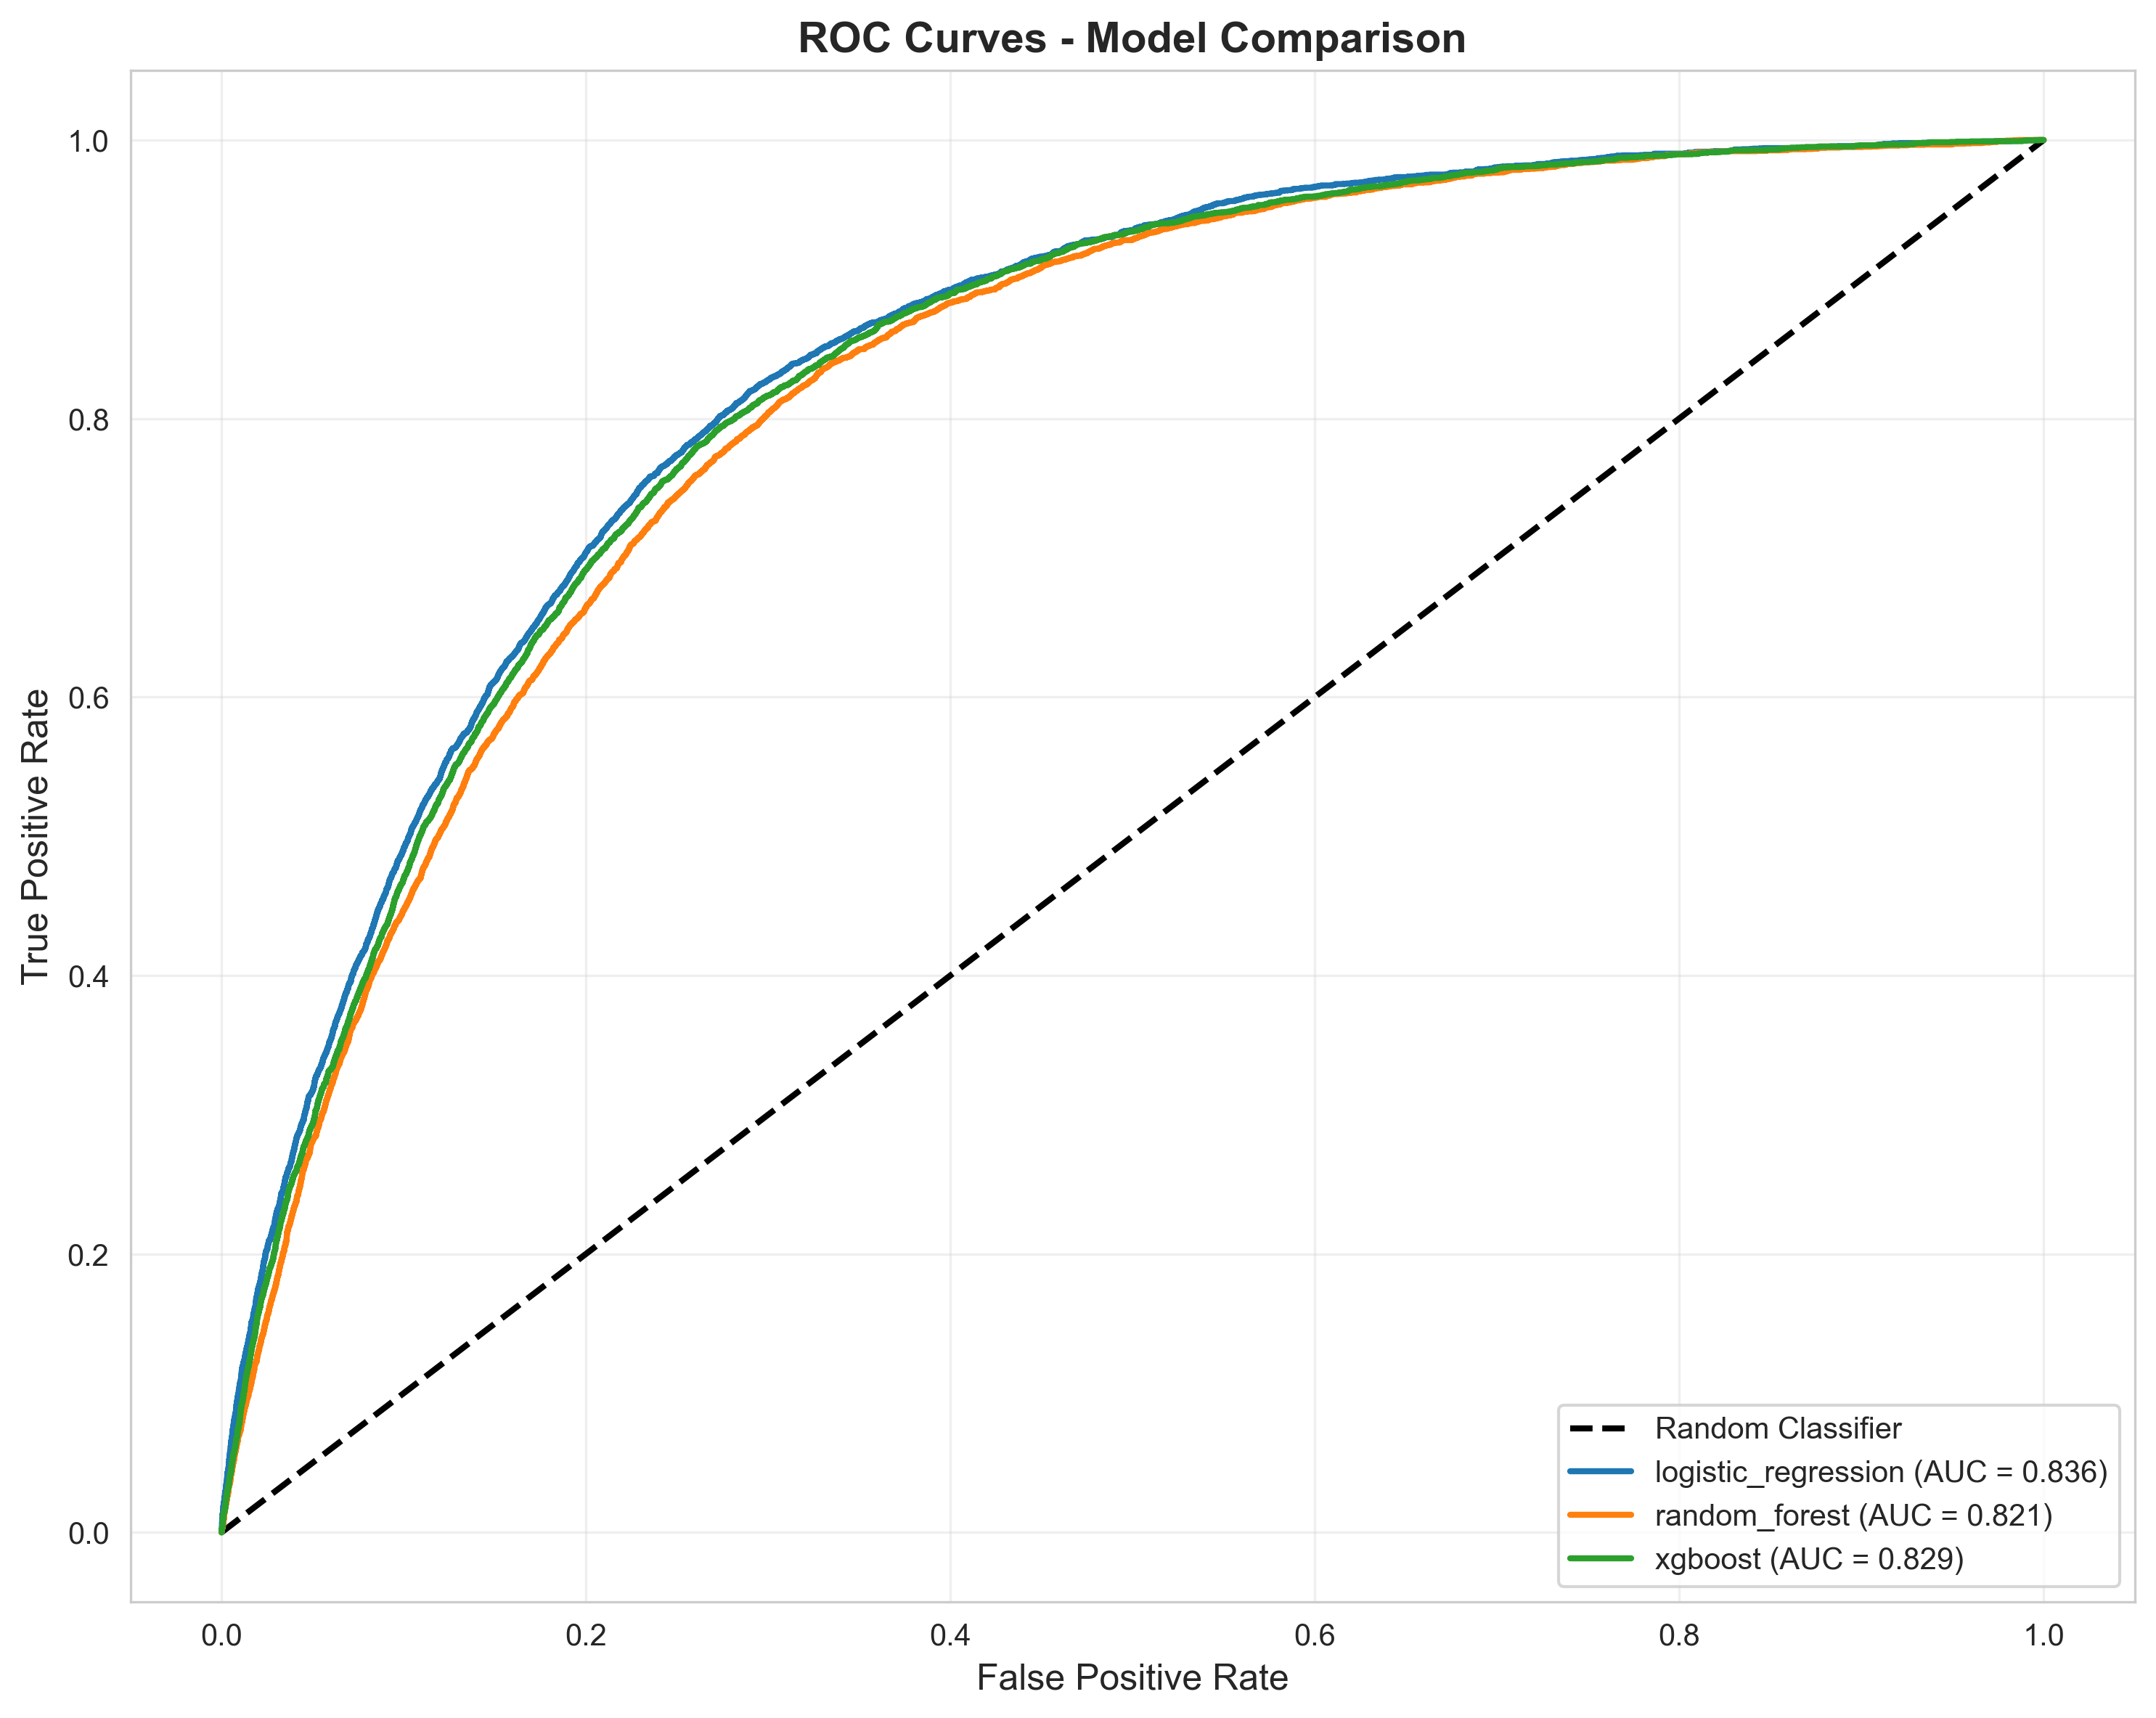
ROC Curves - Receiver Operating Characteristic curves comparing true positive rate vs. false positive rate across all models, demonstrating ranking ability and model discrimination
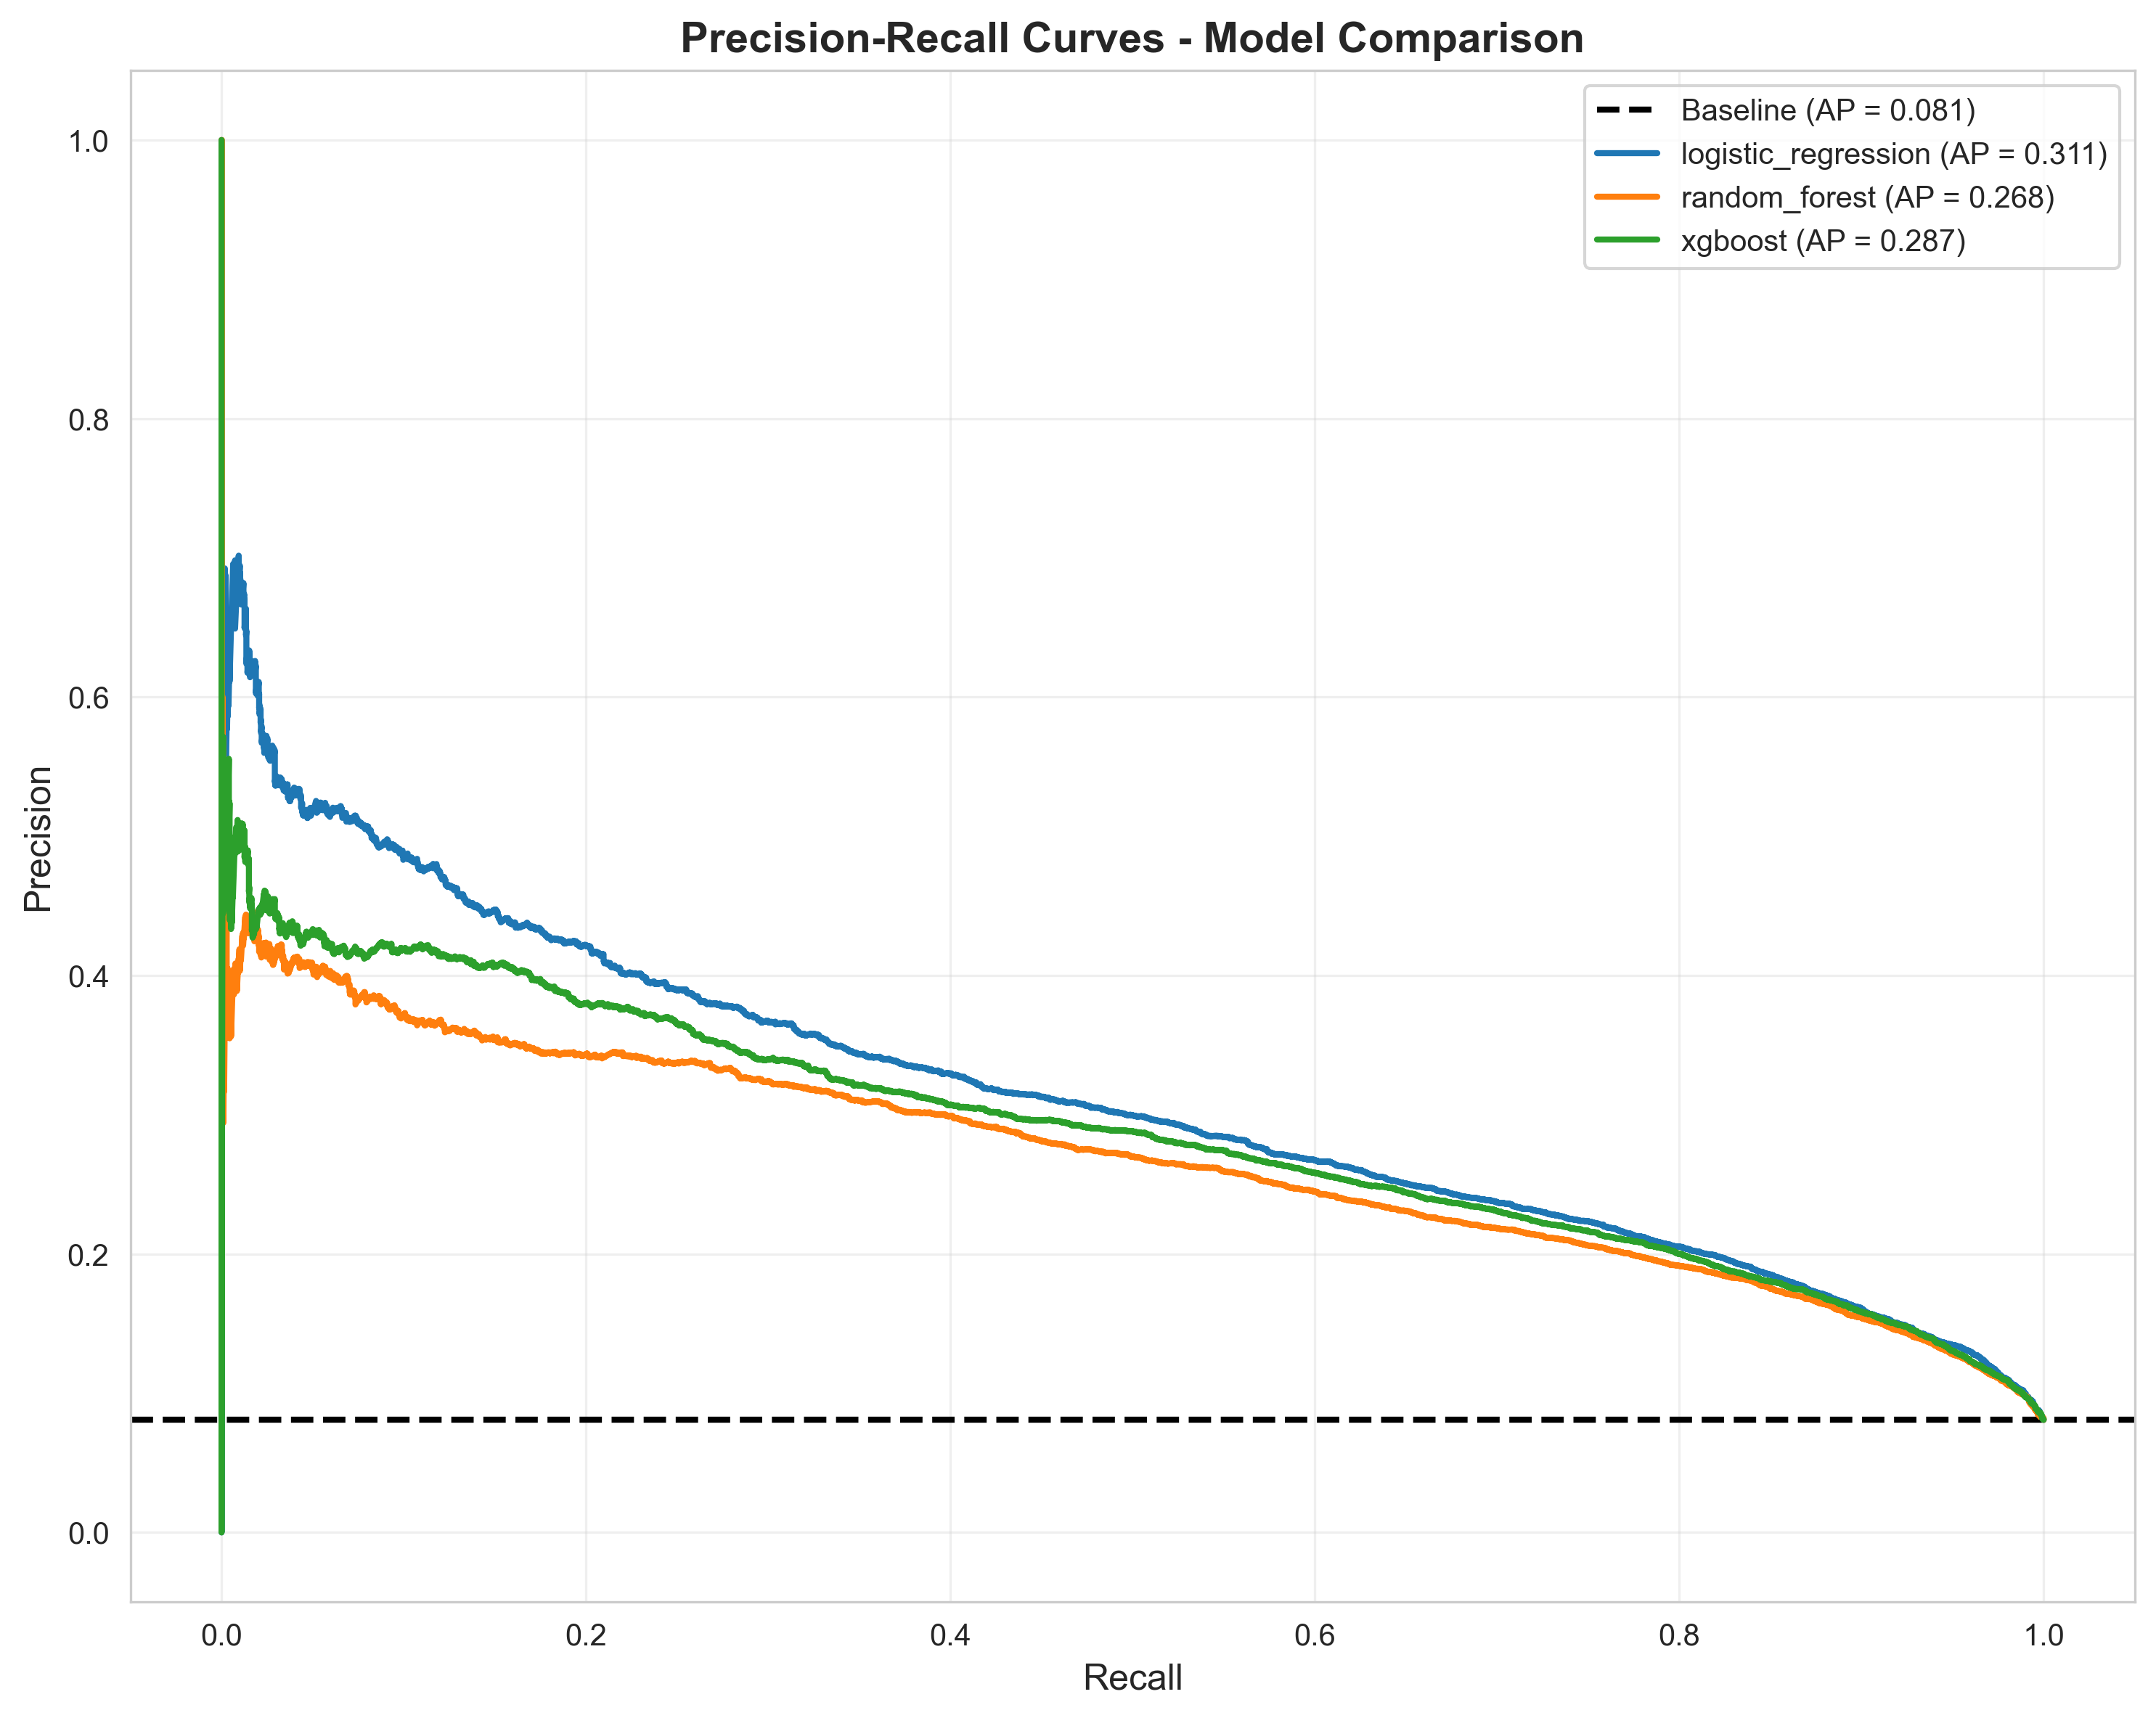
Precision-Recall Curves - Trade-off between precision and recall at different thresholds, essential for evaluating performance under severe class imbalance (8-9% positive class)
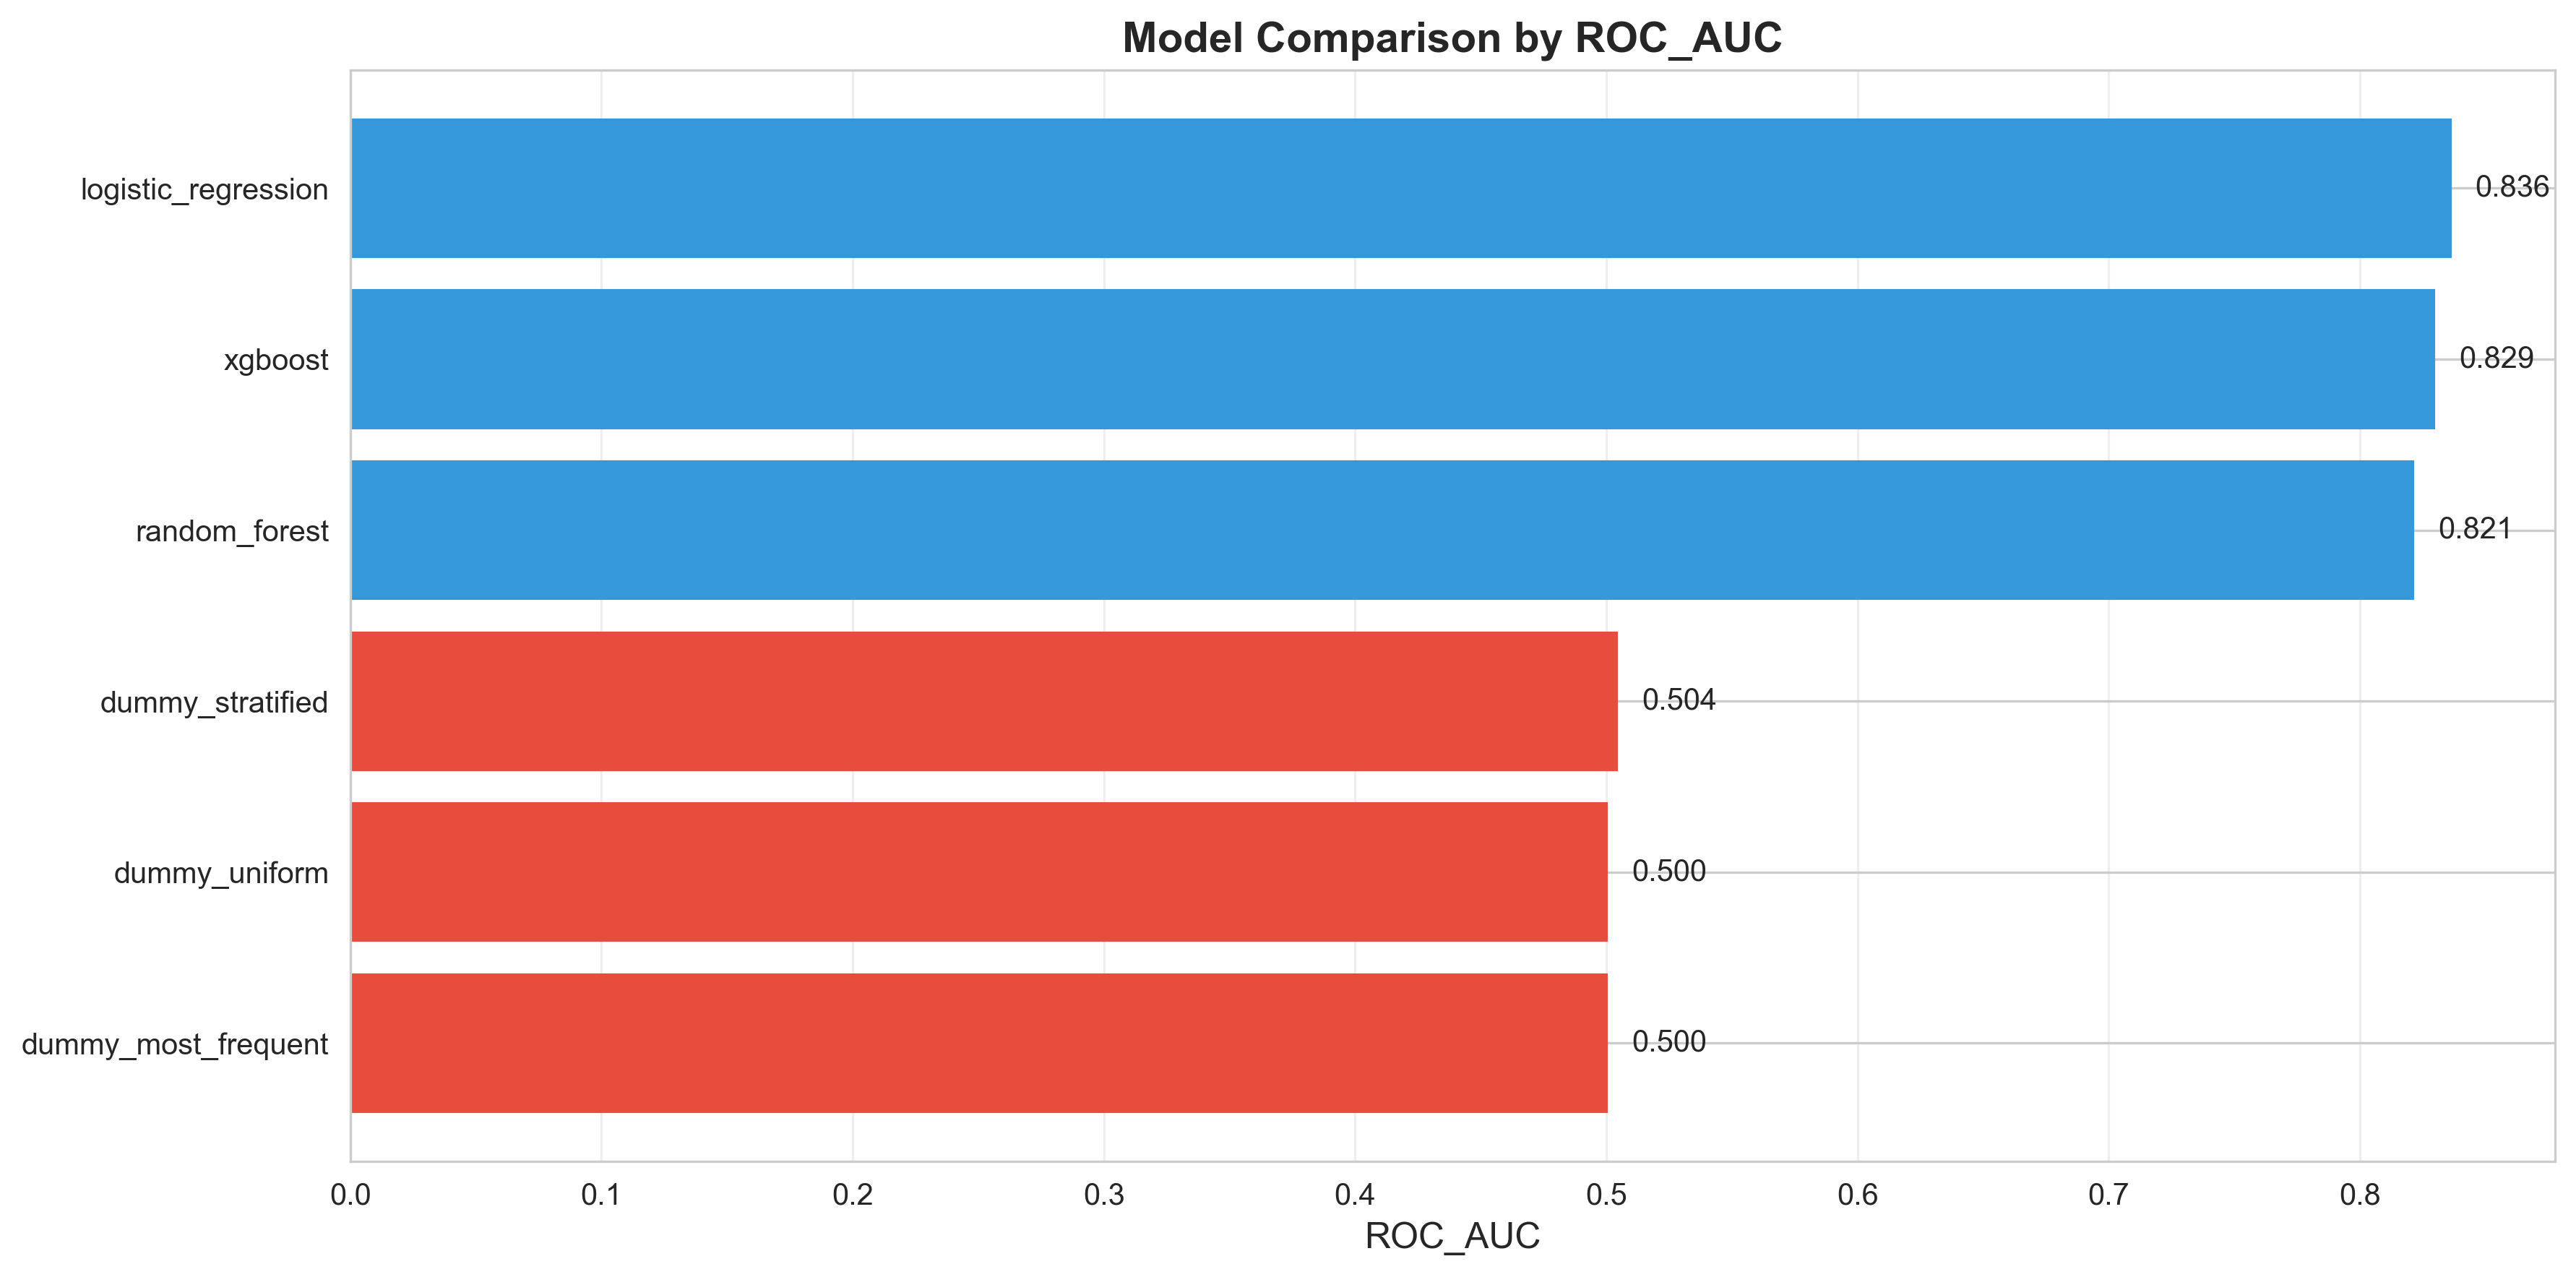
Model Comparison - ROC-AUC Scores - Quantitative comparison of all models' ROC-AUC performance, showing Logistic Regression as the best performer (0.836) with strong ranking ability
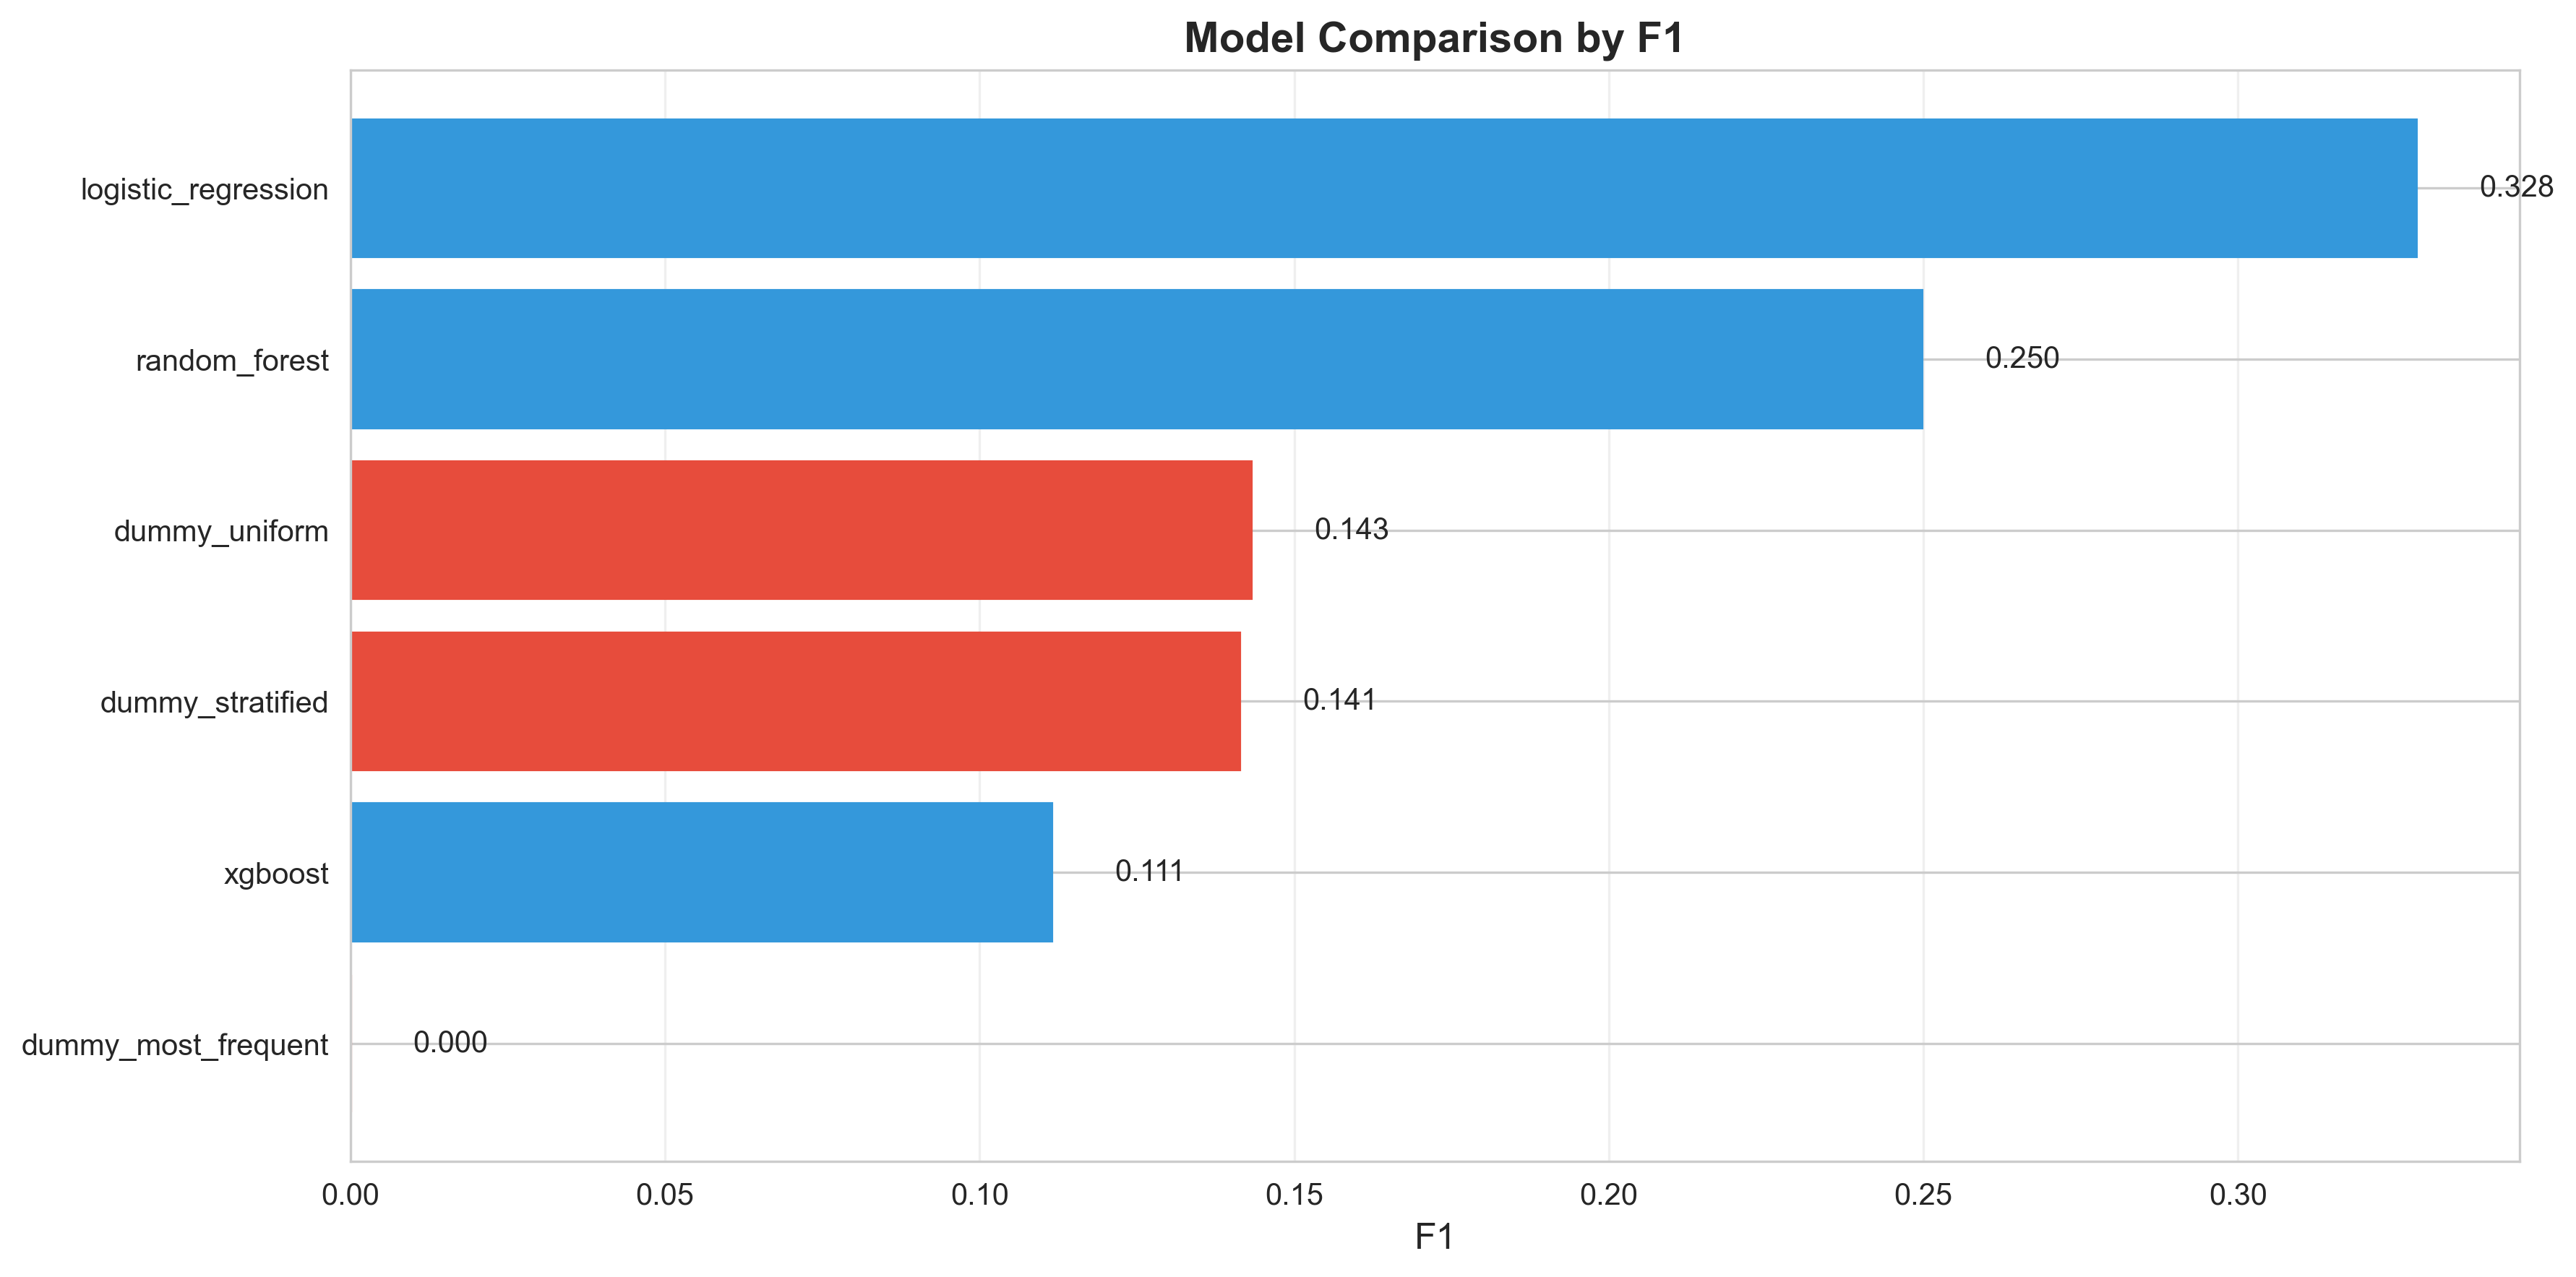
Model Comparison - F1 Scores - Harmonic mean of precision and recall across all models, showing the balance between false positives and false negatives in the context of class imbalance
Back to Projects